Analytics turns connected marketing and commerce data into a reviewable measurement surface. The workflow is not “open a chart and read a number.” You first establish the source, dates, comparison, attribution, currency, and freshness; then you move from the overview to the dimension that can explain the change. Open Analytics and confirm the active workspace.

Before you begin

  • Connect the source that owns the question: Meta Ads, Google Ads, Google Analytics, Shopify, or OpenAI Ads (Beta).
  • Let the relevant source finish its initial import for the date range you need.
  • Know the business outcome and comparison you are testing.
  • Confirm the workspace reporting timezone and display currency.
  • Use a healthy Triple Whale (Beta) connection only when you intentionally need its eligible attribution view.
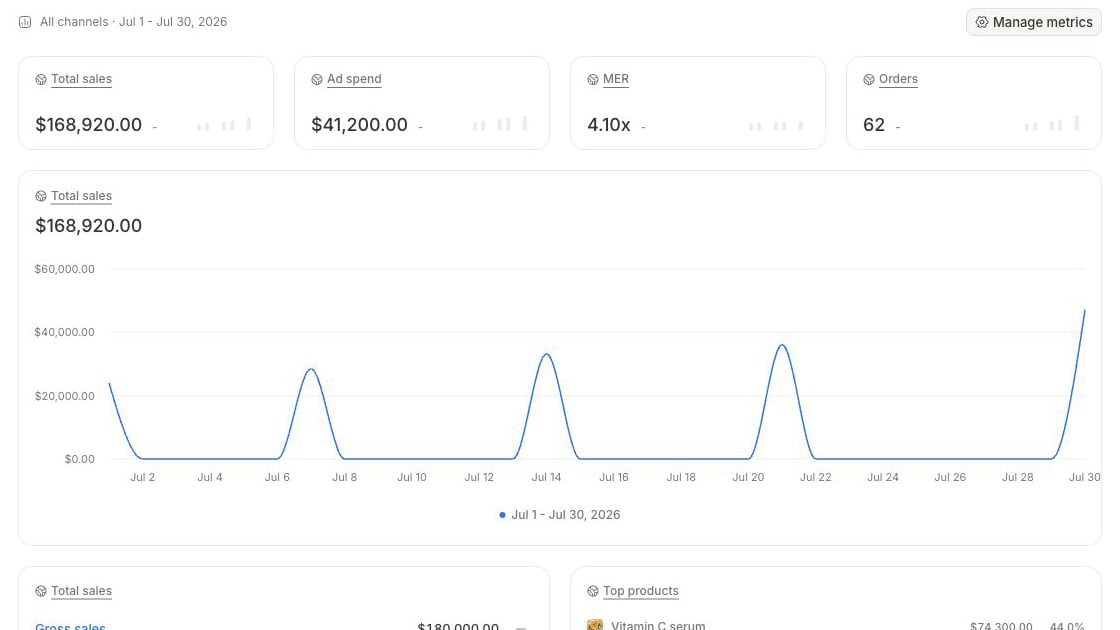
Analytics Performance with cards for total sales, ad spend, MER, and orders above a 30-day total-sales trend and supporting breakdowns

Performance connects headline outcomes to the sales trend and supporting breakdowns for the selected measurement frame.

Choose the surface that owns the next question

Select Analytics to open Performance. Reports appears beneath Analytics in the main navigation. Creatives is a separate performance surface, and Live view opens from the Analytics header.

Establish the measurement frame

The controls at the top are part of the result. Record them with every decision-driving number.
Analytics date picker with Yesterday through Last 12 months presets, a custom range option, a two-month calendar, the selected range, Cancel, and Apply

The date picker combines complete presets with an exact custom range before analysis begins.

1

Choose a complete date window

Open the date control and choose Yesterday, Last 7 days, Last 30 days, a longer preset, or Custom range. The calendar stops at the latest complete day in the workspace reporting timezone. For a custom range, select both boundaries and choose Apply.
2

Choose the chart resolution

Select Daily, Weekly, Monthly, or Yearly. Use a resolution that has enough observations for the window; a yearly resolution does not make a short window more informative.
3

Choose a comparison

Keep Comparison off for an absolute read, or choose Previous period, Year over year, or Custom comparison. For a custom comparison, enter complete start and end dates before using the result.
4

Choose the channel

Use All channels for the blended overview or choose one connected source. A disconnected channel routes you toward its integration instead of supplying fallback data.
5

Confirm accounts and currency

Open Accounts to check which provider resources are represented. Read the currency label; changing workspace display currency happens in Branding settings, while source-currency disclosures remain part of the cards.
6

Choose attribution when available

For eligible Meta or Google views, use Platform unless the question specifically requires a healthy Triple Whale (Beta) view. When Triple Whale (Beta) is selected, also record its attribution model. Treat the switch as a new measurement frame.
Never compare two figures that differ in source, account, date boundary, timezone, currency, attribution source, attribution model, or entity grain without naming that difference.

Analyze a performance change

1. Start with the business result

Read the outcome and spend before secondary ratios. Depending on the selected channel, the first row can include cards such as total sales, ad spend, MER, orders, purchases, CPA, or ROAS. Use Manage metrics to show only the cards relevant to this review.

2. Read the trend, then the composition

Use this order:
  1. Confirm whether the primary result changed versus the selected comparison.
  2. Check whether spend moved in the same direction.
  3. Inspect the time series for when the change started.
  4. Move to the contributing breakdown: channel, campaign, search term, landing page, product, country, device, or another card shown for that source.
  5. Separate the observed contributor from the reason it may have changed.
Do not infer causality from a correlated chart. A campaign can coincide with a sales change without being its cause.

3. Move to the owning object

4. Record the finding

A reusable finding includes:
  • Workspace and provider account
  • Current and comparison date ranges
  • Reporting timezone and currency
  • Channel and attribution source/model
  • Primary result, spend, and the largest contributing breakdown
  • Freshness or partial-coverage disclosure
  • Observed fact, hypothesis, and next verification step as separate statements

Handle syncing and partial coverage

Analytics can render the page structure while one or more providers are still importing the requested range.
Analytics Data is syncing panel for Meta Ads, Google Ads, Google Analytics, and Shopify above syncing placeholders in the metric cards

During an import, Analytics names each contributing source and keeps affected cards in a syncing state until usable coverage arrives.

When this state appears:
  1. Read which providers are named in Data is syncing.
  2. Keep the selected date window unchanged while coverage completes.
  3. Do not translate a placeholder, blank, or missing value into zero.
  4. Use unaffected source cards only if their own freshness and coverage are clear.
  5. Re-run the review after the sync state clears; record that later generation as the decision-grade result.
If a card says freshness is unavailable or coverage is partial, the value can still be useful for orientation, but the disclosure must travel with it.

Compare creative performance in Creatives

Open Creatives when the campaign-level finding points to the asset.
1

Carry over the date window

Use the same complete dates as the campaign or channel diagnosis. The Creatives performance view is backed by Meta delivery rows, so confirm Meta is connected and covers the requested window.
2

Compare like with like

Compare assets that served under compatible objectives, audiences, placements, and delivery volumes. A high result on minimal spend is not automatically a winner.
3

Open the creative detail

Inspect the selected creative’s performance, breakdowns, where it is live, and identifying metadata. Confirm that similarly named or resized assets are not being conflated.
4

Continue in Creative Assets or Briefs

Open the asset when you need its creative detail or reuse context. Carry the supported learning into a new or existing brief; do not convert one result into a permanent brand rule without repeated evidence.

Ask the Marketing Agent from the current view

Give the agent the same measurement frame that is visible in Analytics and attach the responsible campaign, creative, or product when possible.
Review the answer against the cards. If the agent uses a different window, account, or attribution source, correct the scope before using the explanation.

Turn the view into a recurring report

Select Save as report after the current view is correct. Marketer opens the Marketing Agent with the current Analytics context, including the view, channel, dates, comparison, currency, and enabled metrics.
1

Review the seeded request

Confirm that the prompt names the current dashboard context and asks for a draft and real-data preview before activation.
2

Choose cadence and delivery

Set the available schedule and reporting timezone. Choose Slack, email, or both when those destinations are available and configured.
3

Review the preview

Compare its metrics and date logic with Analytics. A preview should preserve the measurement frame rather than silently substitute another source.
4

Activate deliberately

Keep the report as a draft until the schedule and recipients are correct. When it becomes Live, open it under Reports and inspect the next-run state.
5

Verify a delivered run

Open run history after the first scheduled or manual run. Distinguish a successful data run from successful Slack or email delivery.

Use Live view

Open Live view from the Analytics header when you need a current snapshot rather than a complete-day performance review. The view can combine current traffic, commerce, and recent daily context where those sources are connected.
Analytics Live view with visitor map, current traffic and commerce metrics, country breakdown, and Ask Marketer action

Live view combines a current visitor map, traffic and commerce metrics, country context, and an Ask Marketer action.

  • Read the snapshot timestamp before sharing it.
  • Treat a retained or degraded source as stale even when its last usable value remains visible.
  • Use the available retry when a source read fails.
  • Choose Ask Marketer with the current snapshot context when you need an explanation.
  • Return to Performance for complete-day comparisons and attribution-sensitive decisions.

Choose workspace conversion metrics

When available, open Settings → Conversion metrics to choose non-purchase conversions displayed beside spend and purchases. You can select available provider conversion actions, give them workspace display names, reorder them, and choose a headline metric.
Some workspaces show “Conversion metrics aren’t available yet.” In that state, do not document or infer cards that are not present. When available, these cards use platform attribution and are not shown with Triple Whale (Beta) attribution selected.
Avoid adding duplicate labels for the same provider action or combining conversions with different definitions.

Completion checklist

  • The workspace and connected accounts are correct.
  • Current and comparison windows use complete, intended dates.
  • Timezone, currency, channel, resolution, attribution source, and attribution model are recorded.
  • Every decision-driving source has usable coverage or an explicit limitation.
  • The primary result and spend are reviewed before ratios and breakdowns.
  • The responsible campaign, creative, product, or destination was verified in its owning surface.
  • Facts, hypotheses, and recommended next steps are separated.
  • A recurring report, if created, produced and delivered at least one verified run.

Troubleshooting

Confirm the selected channel is connected, the account is included, the date range contains activity, and the initial import completed. Try a complete recent preset before assuming the source has no data.
Align the exact account, dates, timezone, currency, attribution source, attribution model, and provider reporting rule. Capture both values and the last usable freshness state if the mismatch remains.
Check for unequal windows, partial days, a custom comparison that is incomplete, promotions, one-time spend, changed attribution, or changed currency. Begin again with equivalent complete periods.
Confirm that both views use the same dates and source. A creative can serve across multiple objects, while Campaigns aggregates at campaign, ad-set, or ad grain.
Open the provider in Integrations and inspect authorization, selected resources, and sync coverage. Retry the source there when available; do not repeatedly change the Analytics window to force completion.
Open Reports, inspect its status and run history, and verify the schedule timezone, Slack channel or email recipients, destination connection, run result, and delivery result separately.

Next step

Inspect the campaign

Move from a measured change to the exact provider object.

Configure recurring reporting

Turn a reviewed measurement frame into a monitored report.
Last modified on August 9, 2026